
A GUI to Set Simulink Model Parameters
About the Simulink Model Parameters Example This example illustrates how to create a GUI that sets the parameters of a Simulink® model. In addition, the GUI can run the simulation and plot the results...
Matlab Simulink Examples
About the Simulink Model Parameters Example This example illustrates how to create a GUI that sets the parameters of a Simulink® model. In addition, the GUI can run the simulation and plot the results...

Figure 1: A ball is thrown up with a velocity of 15 m/s from a height of 10 m. A bouncing ball model is a classic example of a hybrid dynamic system. A...
Building the Model Simulink® provides a set of predefined blocks that you can combine to create a detailed block diagram of your system. Tools for hierarchical modeling, data management, and subsystem customization enable you...
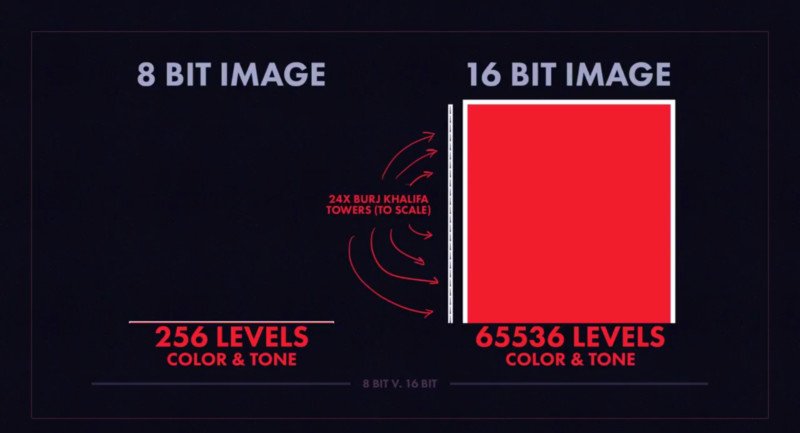
8-Bit and 16-Bit Indexed Images Double-precision (64-bit) floating-point numbers are the default MATLAB representation for numeric data. However, to reduce memory requirements for working with images, you can store images as 8-bit or 16-bit...
Wind Mapping Data The MATLAB vector data set called wind represents air currents over North America. This example uses a combination of techniques: Stream lines to trace the wind velocity Slice planes to show...
What Stream Ribbons Can Show Stream ribbons illustrate direction of flow, similar to stream lines, but can also show rotation about the flow axis by twisting the ribbon-shaped flow line. The streamribbon function enables...
Matlab Getting Started GUI Layout GUIDE, the MATLAB graphical user interface development environment, provides a set of tools for creating graphical user interfaces (GUIs). These tools simplify the process of laying out and programming...
Follow:
More