
A GUI to Set Simulink Model Parameters
About the Simulink Model Parameters Example This example illustrates how to create a GUI that sets the parameters of a Simulink® model. In addition, the GUI can run the simulation and plot the results...
Matlab Simulink Examples
About the Simulink Model Parameters Example This example illustrates how to create a GUI that sets the parameters of a Simulink® model. In addition, the GUI can run the simulation and plot the results...
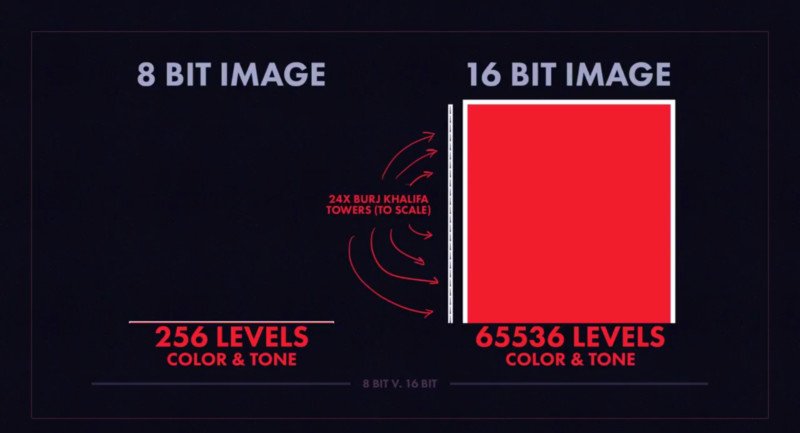
8-Bit and 16-Bit Indexed Images Double-precision (64-bit) floating-point numbers are the default MATLAB representation for numeric data. However, to reduce memory requirements for working with images, you can store images as 8-bit or 16-bit...
Wind Mapping Data The MATLAB vector data set called wind represents air currents over North America. This example uses a combination of techniques: Stream lines to trace the wind velocity Slice planes to show...
What Stream Ribbons Can Show Stream ribbons illustrate direction of flow, similar to stream lines, but can also show rotation about the flow axis by twisting the ribbon-shaped flow line. The streamribbon function enables...
This demonstration uses the FFT function to analyze the variations in sunspot activity over the last 300 years. Sunspot activity is cyclical, reaching a maximum about every 11 years. Let’s confirm that. Here is...
What Is the Microsoft .NET Framework? The Microsoft .NET Framework is an integral Windows component that provides a large body of precoded solutions to common program requirements, and manages the execution of programs written...
Image Types and Display Methods To display a graphics file image, use either image or imagesc. For example, assuming RGB is an image, figure(‘Position’,[100 100 size(RGB,2) size(RGB,1)]); image(RGB); set(gca,’Position’,[0 0 1 1]) [warning]This image...
Follow:
More