
A GUI to Set Simulink Model Parameters
About the Simulink Model Parameters Example This example illustrates how to create a GUI that sets the parameters of a Simulink® model. In addition, the GUI can run the simulation and plot the results...
Matlab Simulink Examples
About the Simulink Model Parameters Example This example illustrates how to create a GUI that sets the parameters of a Simulink® model. In addition, the GUI can run the simulation and plot the results...
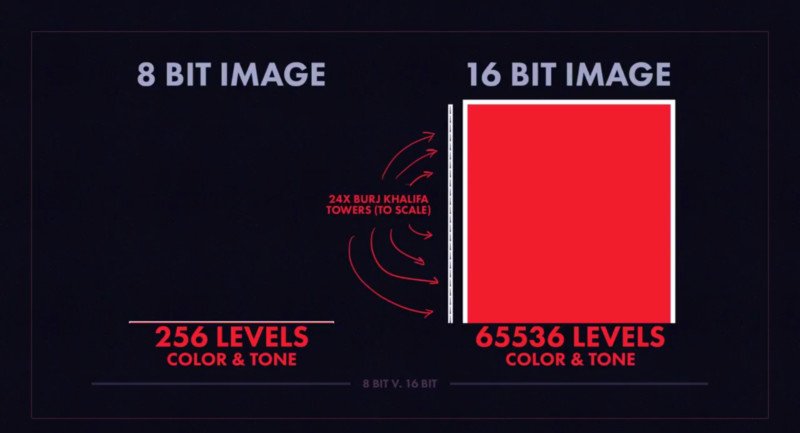
8-Bit and 16-Bit Indexed Images Double-precision (64-bit) floating-point numbers are the default MATLAB representation for numeric data. However, to reduce memory requirements for working with images, you can store images as 8-bit or 16-bit...
Wind Mapping Data The MATLAB vector data set called wind represents air currents over North America. This example uses a combination of techniques: Stream lines to trace the wind velocity Slice planes to show...
Core graphics objects include basic drawing primitives: Line, text, and polygon shells (patch objects) Specialized objects like surfaces, which are composed of a rectangular grid of vertices Images Light objects, which are not visible...
Figures are the windows in which MATLAB displays graphics. Figures contain menus, toolbars, user-interface objects, context menus, axes and, as axes children, all other types of graphics objects. MATLAB places no limits on the...
Matlab Functions Display Fully Commented Example Code The class block is the code that starts with the classdef key word and terminates with the end key word. The following example illustrated a simple class...
Overview of Desktop Layouts When you end a session, MATLAB saves the current desktop arrangement. The next time you start MATLAB, the desktop appears like the way you left it. However, tools such as...
Follow:
More