Programming and Scripts
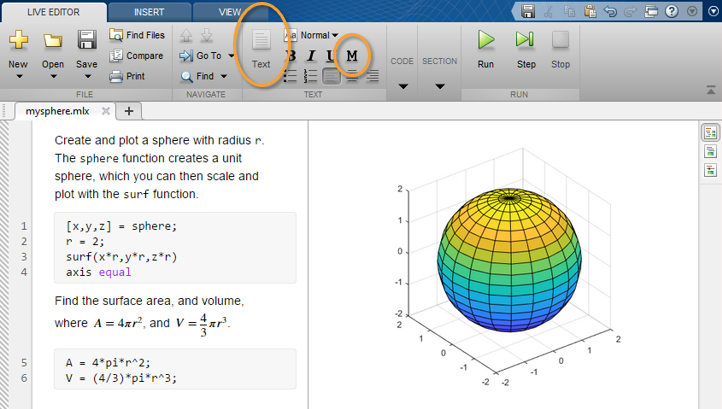
Scripts To create a script, use the edit command, edit mysphere This command opens a blank file named mysphere.m. Enter some code that creates a unit sphere, doubles the radius, and plots the results: [x,y,z] = sphere;...
Matlab Simulink Examples
Scripts To create a script, use the edit command, edit mysphere This command opens a blank file named mysphere.m. Enter some code that creates a unit sphere, doubles the radius, and plots the results: [x,y,z] = sphere;...

About the Simulink Model Parameters Example This example illustrates how to create a GUI that sets the parameters of a Simulink® model. In addition, the GUI can run the simulation and plot the results...
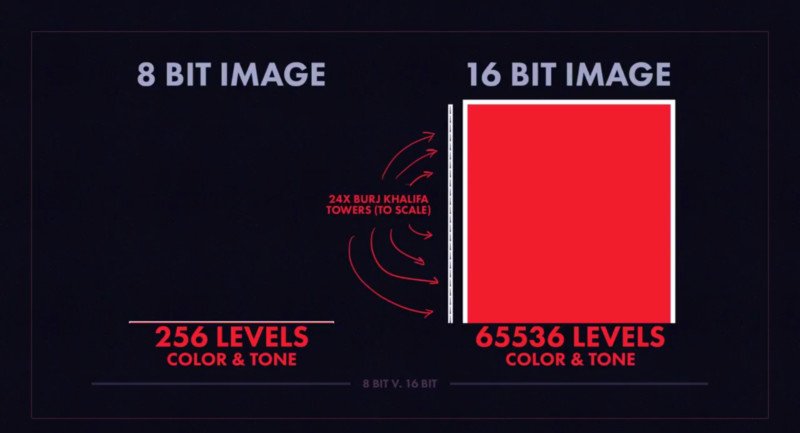
8-Bit and 16-Bit Indexed Images Double-precision (64-bit) floating-point numbers are the default MATLAB representation for numeric data. However, to reduce memory requirements for working with images, you can store images as 8-bit or 16-bit...
The colon, :, is one of MATLAB’s most important operators. It occurs in several different forms. The expression 1:10 is a row vector containing the integers from 1 to 10 1 2 3 4...
What Is Image Data? The basic MATLAB data structure is the array, an ordered set of real or complex elements. An array is naturally suited to the representation of images, real-valued, ordered sets of...
What Stream Ribbons Can Show Stream ribbons illustrate direction of flow, similar to stream lines, but can also show rotation about the flow axis by twisting the ribbon-shaped flow line. The streamribbon function enables...
Image Types and Display Methods To display a graphics file image, use either image or imagesc. For example, assuming RGB is an image, figure(‘Position’,[100 100 size(RGB,2) size(RGB,1)]); image(RGB); set(gca,’Position’,[0 0 1 1]) [warning]This image...
Follow:
More