Programming and Scripts
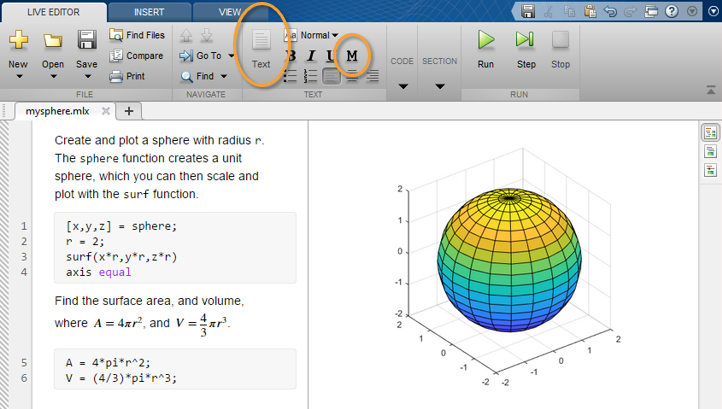
Scripts To create a script, use the edit command, edit mysphere This command opens a blank file named mysphere.m. Enter some code that creates a unit sphere, doubles the radius, and plots the results: [x,y,z] = sphere;...
Matlab Simulink Examples
Scripts To create a script, use the edit command, edit mysphere This command opens a blank file named mysphere.m. Enter some code that creates a unit sphere, doubles the radius, and plots the results: [x,y,z] = sphere;...
About the Simulink Model Parameters Example This example illustrates how to create a GUI that sets the parameters of a Simulink® model. In addition, the GUI can run the simulation and plot the results...
Wind Mapping Data The MATLAB vector data set called wind represents air currents over North America. This example uses a combination of techniques: Stream lines to trace the wind velocity Slice planes to show...
What Stream Ribbons Can Show Stream ribbons illustrate direction of flow, similar to stream lines, but can also show rotation about the flow axis by twisting the ribbon-shaped flow line. The streamribbon function enables...
Users typically create annotation objects from the Plot Edit toolbar or the Insert menu (select Plot Edit in the View menu to display the Plot Edit toolbar). However, you can also create annotation objects...
Core graphics objects include basic drawing primitives: Line, text, and polygon shells (patch objects) Specialized objects like surfaces, which are composed of a rectangular grid of vertices Images Light objects, which are not visible...
MATLAB User-Defined Classes A MATLAB class definition is a template whose purpose is to provide a description of all the elements that are common to all instances of the class. Class members are the...
Follow:
More