Programming and Scripts
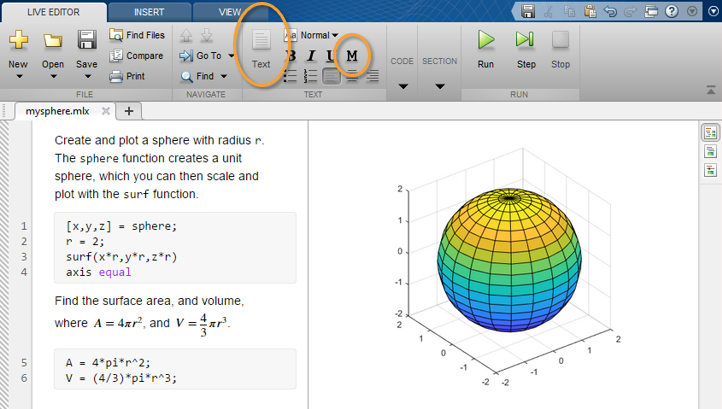
Scripts To create a script, use the edit command, edit mysphere This command opens a blank file named mysphere.m. Enter some code that creates a unit sphere, doubles the radius, and plots the results: [x,y,z] = sphere;...
Matlab Simulink Examples
Scripts To create a script, use the edit command, edit mysphere This command opens a blank file named mysphere.m. Enter some code that creates a unit sphere, doubles the radius, and plots the results: [x,y,z] = sphere;...

About the Simulink Model Parameters Example This example illustrates how to create a GUI that sets the parameters of a Simulink® model. In addition, the GUI can run the simulation and plot the results...
Matlab Getting Started GUI Layout GUIDE, the MATLAB graphical user interface development environment, provides a set of tools for creating graphical user interfaces (GUIs). These tools simplify the process of laying out and programming...
Image Types and Display Methods To display a graphics file image, use either image or imagesc. For example, assuming RGB is an image, figure(‘Position’,[100 100 size(RGB,2) size(RGB,1)]); image(RGB); set(gca,’Position’,[0 0 1 1]) [warning]This image...
Users typically create annotation objects from the Plot Edit toolbar or the Insert menu (select Plot Edit in the View menu to display the Plot Edit toolbar). However, you can also create annotation objects...
Generating Matlab Code Create a Stem Plot and Generate Code for It Suppose you have created the following graph. t = 0:.2:20; alpha =.055; stem(t,exp(-alpha*t).*sin(5*t)) Use the Property Editor to modify the graph. Select...
Why Edit Plots? MATLAB graphs are formatted to provide readability, setting the scale of axes, including tick marks on the axes, and using color and line style to distinguish the plots in the graph....
Follow:
More