Programming and Scripts
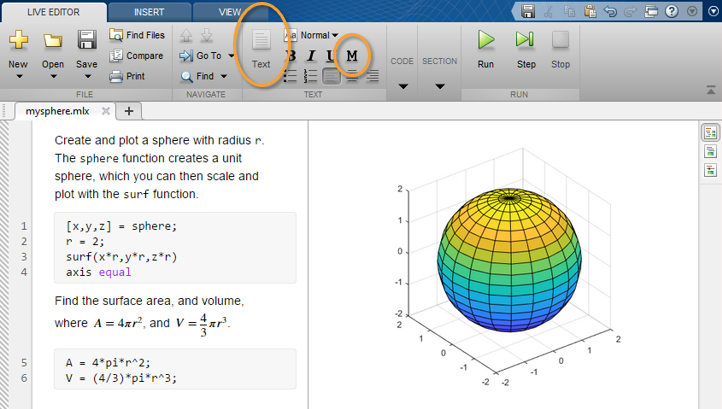
Scripts To create a script, use the edit command, edit mysphere This command opens a blank file named mysphere.m. Enter some code that creates a unit sphere, doubles the radius, and plots the results: [x,y,z] = sphere;...
Matlab Simulink Examples
Scripts To create a script, use the edit command, edit mysphere This command opens a blank file named mysphere.m. Enter some code that creates a unit sphere, doubles the radius, and plots the results: [x,y,z] = sphere;...
Matlab Getting Started GUI Layout GUIDE, the MATLAB graphical user interface development environment, provides a set of tools for creating graphical user interfaces (GUIs). These tools simplify the process of laying out and programming...
Image Types and Display Methods To display a graphics file image, use either image or imagesc. For example, assuming RGB is an image, figure(‘Position’,[100 100 size(RGB,2) size(RGB,1)]); image(RGB); set(gca,’Position’,[0 0 1 1]) [warning]This image...

Matlab Plot A number of high-level plotting functions create plot objects. The properties of plot objects provide easy access to the important properties of the core graphics objects that the plot objects contain. Plot...
Core graphics objects include basic drawing primitives: Line, text, and polygon shells (patch objects) Specialized objects like surfaces, which are composed of a rectangular grid of vertices Images Light objects, which are not visible...
Overview of Formatting MATLAB Code for Publishing This section describes ways to control how output that the MATLAB software generates when it evaluates executable MATLAB code for a published document. For example, you can...
What Are Plotting Tools? The modular, interactive plotting environment called plotting tools enables you to Create various type of graphs Select variables to plot directly from a workspace browser Easily create and manipulate subplots...
Follow:
More