
Introduction to Robotics with Matlab
Are you interested in robotics and how they work? Do you want to learn more about how Matlab can be used to control, simulate, and analyze robotics systems? In this blog post, we will...
Matlab Simulink Examples
Are you interested in robotics and how they work? Do you want to learn more about how Matlab can be used to control, simulate, and analyze robotics systems? In this blog post, we will...
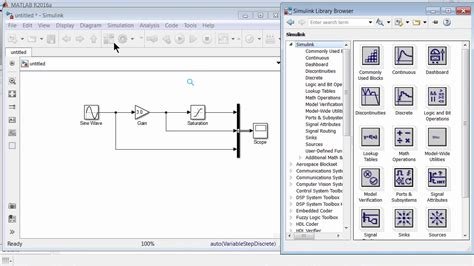
Are you interested in learning more about Simulink in Matlab? Simulink is a graphical programming environment for modeling, simulating, and analyzing dynamic systems. In this blog post, we will explore the different aspects of...
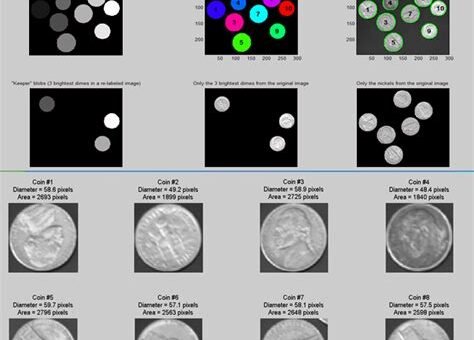
Are you looking to dive into the world of image processing and analysis in Matlab? One of the fundamental techniques in this field is image segmentation, a process of partitioning an image into multiple...

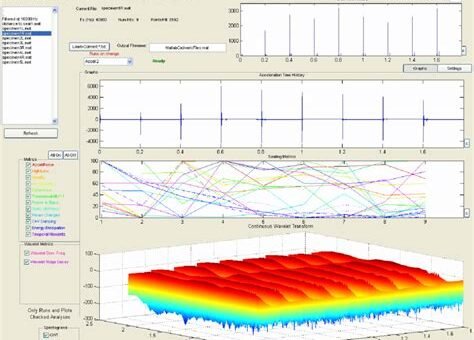
Are you looking to add more interactivity to your plots and visualizations in Matlab? In this blog post, we will explore the world of interactive plots in Matlab, and how you can take your...
Are you looking to create powerful and user-friendly Graphical User Interfaces (GUIs) in Matlab? In this blog post, we will explore the process of building GUIs in Matlab, from the basics to advanced customization....

If you’re interested in understanding and analyzing how dynamic systems behave, then simulation in Matlab could be a game-changer for you. In this blog post, we’ll explore the world of simulating dynamic systems using...

Are you looking to take your Matlab programming to the next level? If so, then Stateflow may be the next tool you need to add to your toolbox. In this blog post, we will...

Neural networks are a powerful tool in the field of artificial intelligence and machine learning. They are designed to mimic the way the human brain works, using interconnected nodes to process and learn from...
Follow:
More